Everyone is adding Ollie Gordon. The data likes Jaylen Wright better.
De'Von Achane is out for the season, so we went through every carry Miami's backs have taken since 2024 to see which one is worth adding.
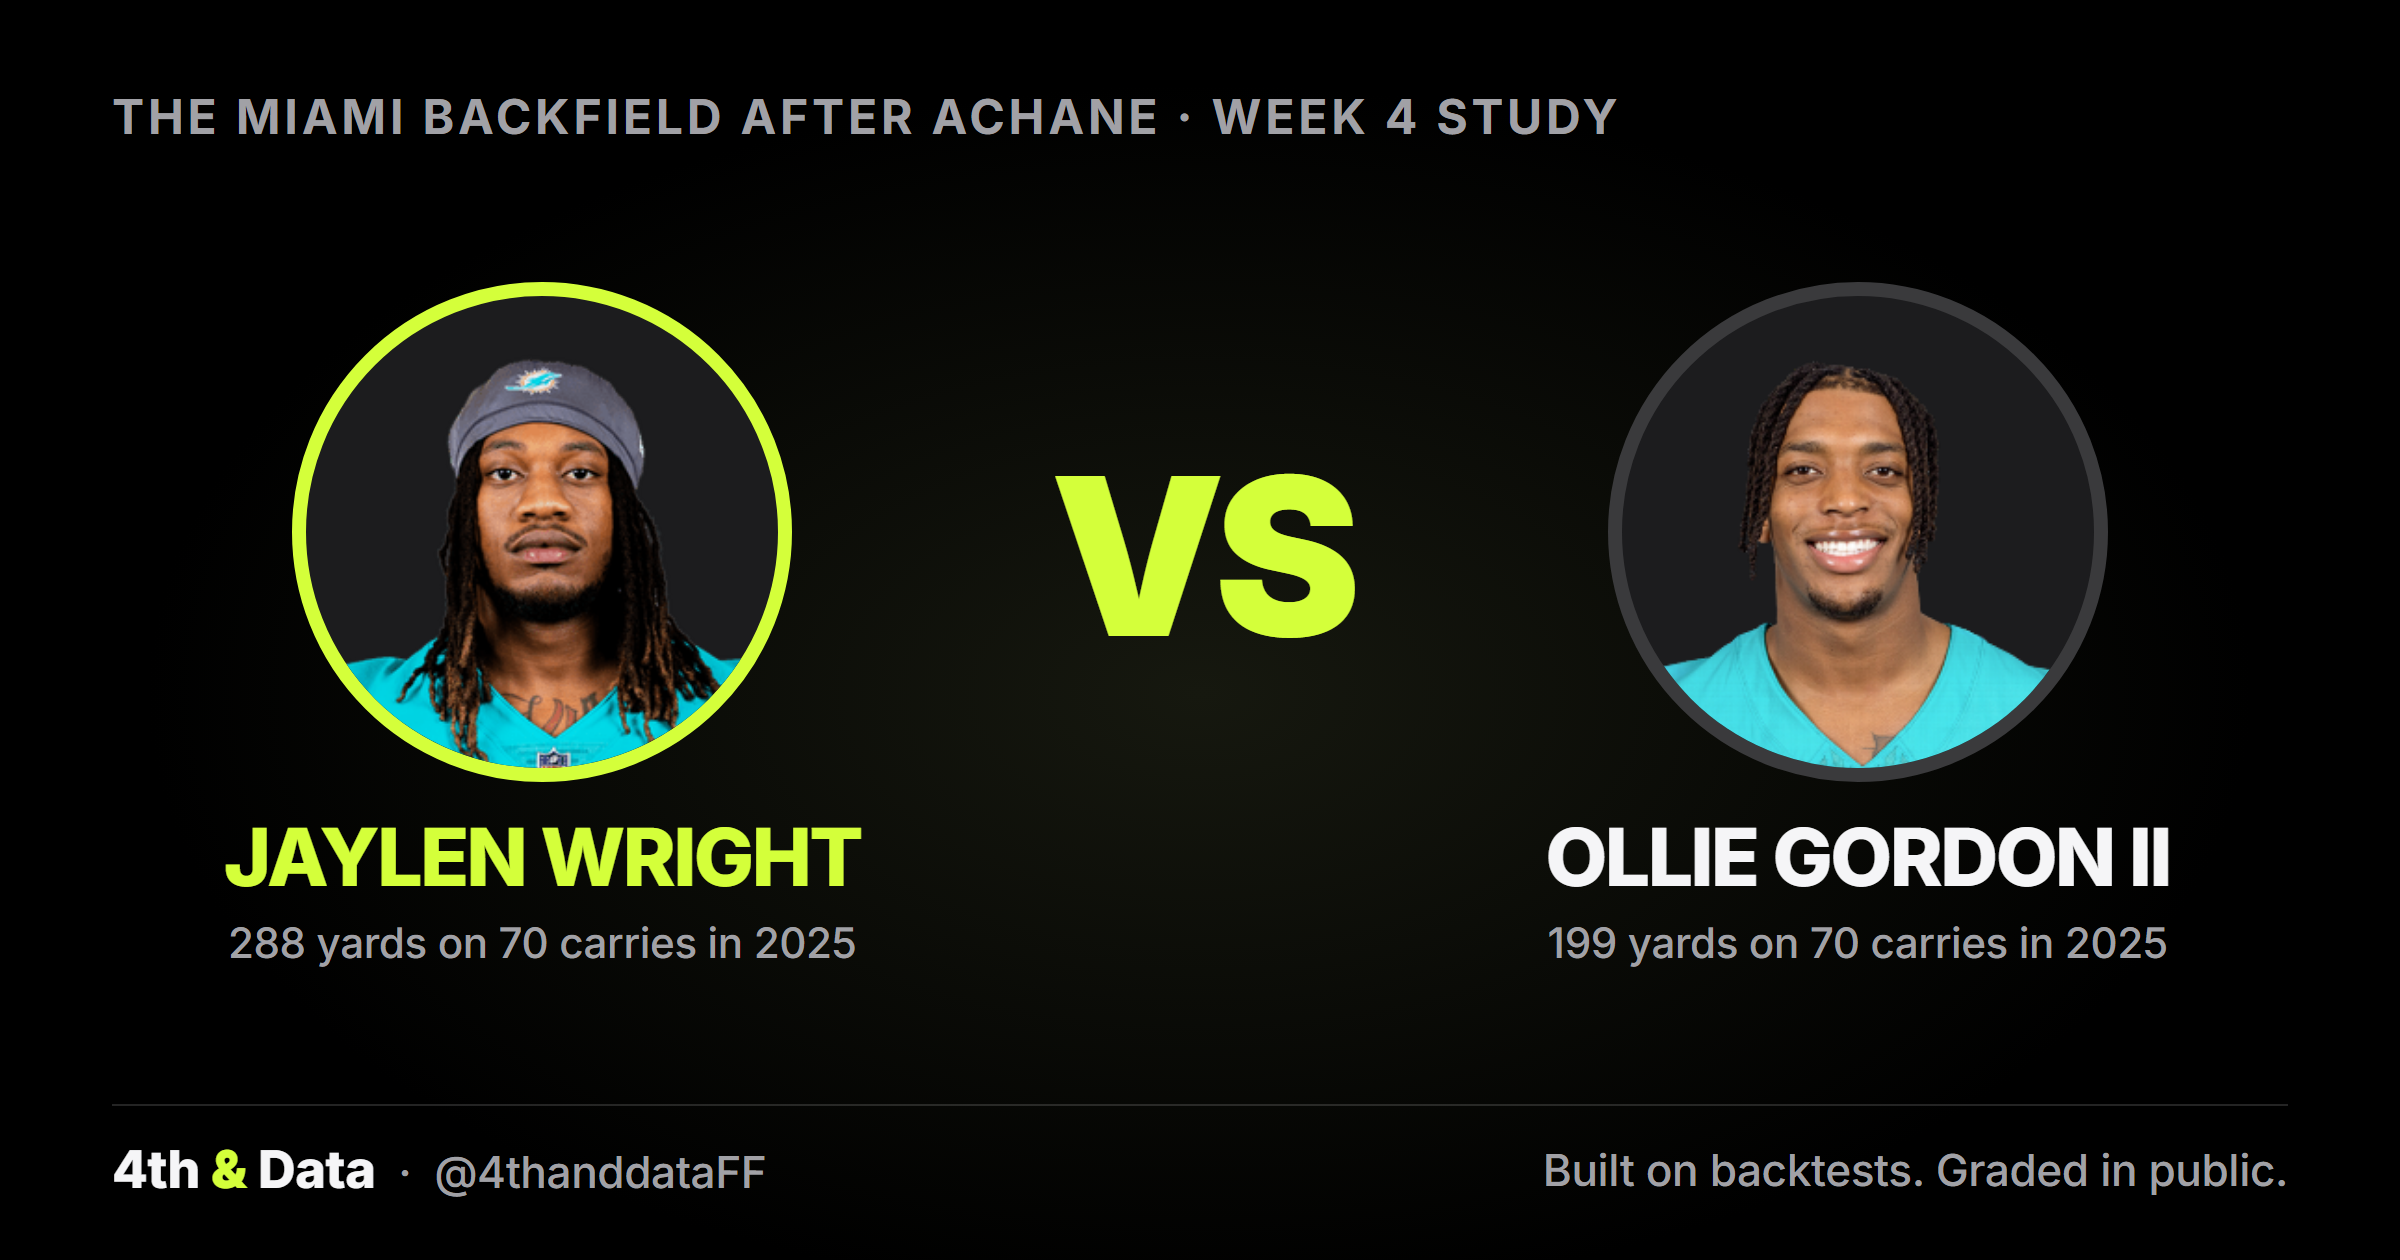
- On the same 70 carries in 2025, Wright ran better than Gordon. Gordon's 2.8 yards a carry was 64th of 65 backs.
- Gordon's big Week 3 was volume plus a touchdown. Without the touchdown he scored 8.5 points.
- Wright is listed first on the depth chart and will cost less, but he has to get healthy, and Miami has scored 12.0 points a game. Add him only if you are desperate at running back.
What happened in Week 3
De'Von Achane tore his ACL, a major ligament in the knee, in the first quarter against Kansas City. He is out for the season.
Jaylen Wright missed the game with a foot injury, so Ollie Gordon was the only healthy back. After Achane left, Gordon took 17 of the 19 carries that did not go to the quarterback and scored 14.5 PPR points, 13th among backs that week. PPR means every catch is worth a point. He was then added in more than 5 million leagues in a single day.
The catch is that Wright is still listed ahead of Gordon on Miami's depth chart, the team's order at each position. He will likely need to practice this week to play in Week 4.
Same team, same year, same 70 carries
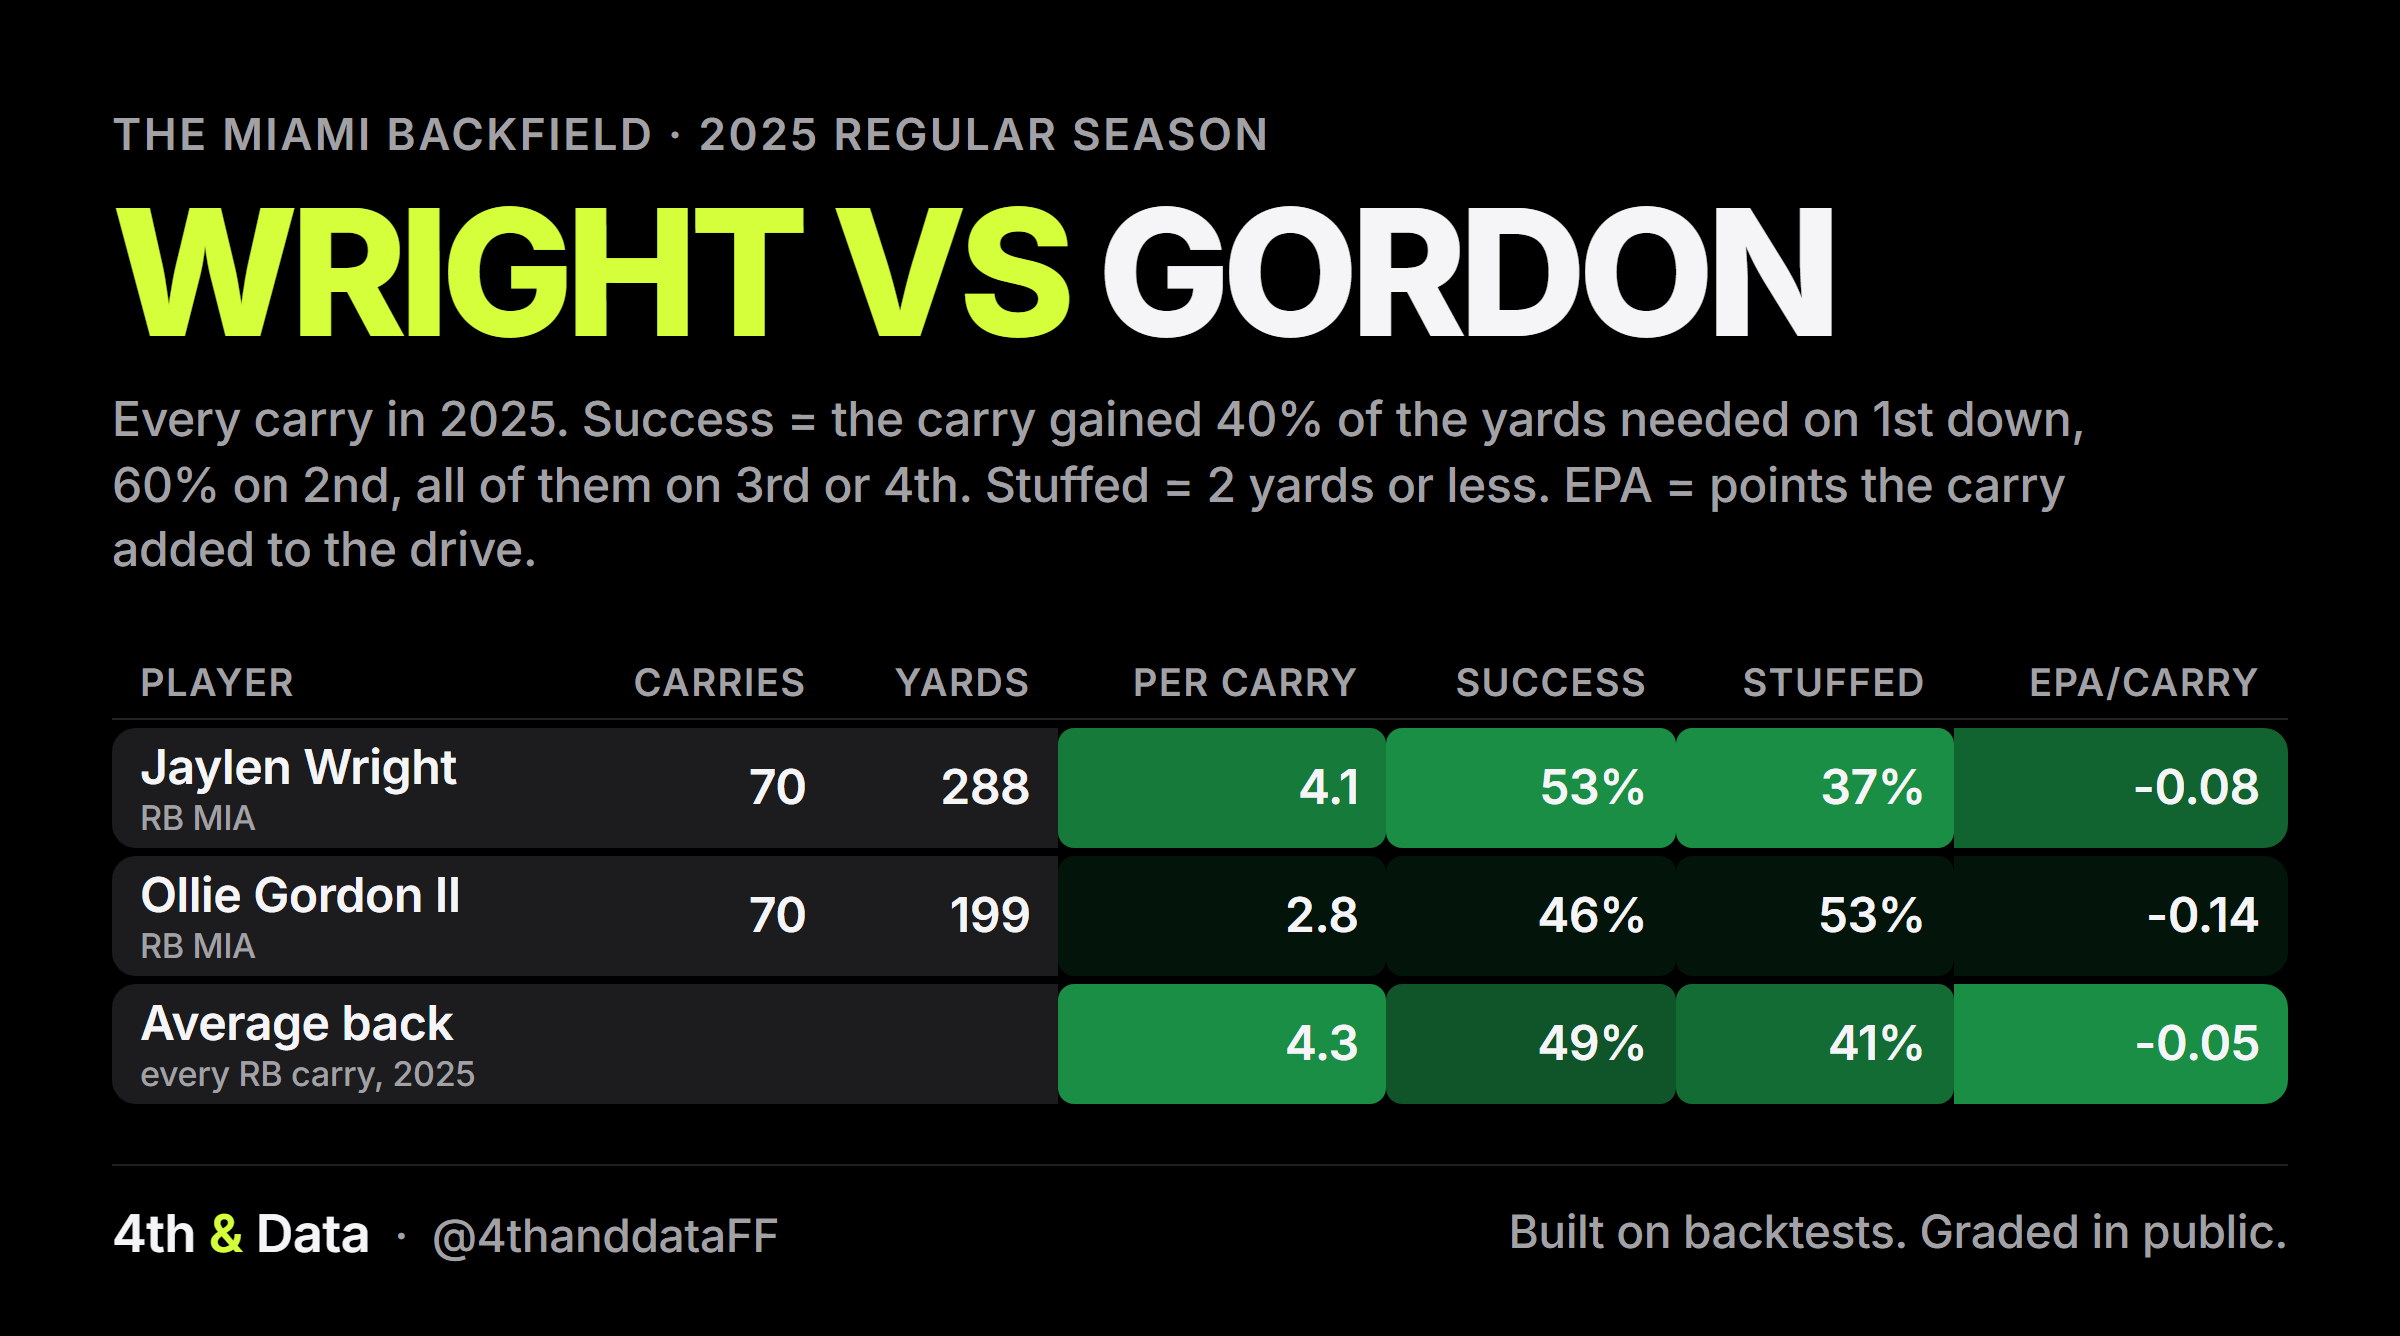
Wright and Gordon each carried exactly 70 times in 2025, for the same team. That is about as fair a test as football gives you.
| 2025 regular season | Yards a carry | Success | Stuffed | EPA a carry | Carries | Yards |
|---|---|---|---|---|---|---|
| Jaylen Wright | 4.11 39th | 52.9% 24th | 37.1% 13th | -0.081 45th | 70 | 288 |
| Ollie Gordon II | 2.84 64th | 45.7% 56th | 52.9% 65th | -0.137 56th | 70 | 199 |
| De'Von Achane for scale | 5.67 2nd | 49.2% 38th | 41.6% 34th | +0.059 6th | 238 | 1,350 |
| Average back | 4.35 | 49.5% | 41.5% | -0.051 |
Ranks are among the 65 backs with 50 or more carries in 2025. Rank 1 is the best, so for stuffed it means stuffed the least.
Gordon's 2.8 yards a carry was 64th of 65, and no back was stuffed, stopped for 2 yards or less, more often. It happened on 52.9% of his carries.
Wright's success rate was 24th of 65, and only 12 backs were stuffed less often. A successful carry keeps the offense on schedule, gaining 40% of the yards needed on first down, 60% on second, or all of them on third and fourth.
After the first defender touched them, Wright gained 2.5 yards a carry and Gordon 1.7, from charting data, where people log every play by hand. That part of a run is mostly on the back.
Neither back helped much by EPA per carry, the points each carry added to the drive on average. Both were below the average back, Wright 45th and Gordon 56th. Wright was the better back, not a hidden star.
Week 3, with the backfield to himself
Week 3 is the one game Gordon has had the job to himself. He was on the field for 84% of Miami's snaps, the plays the offense ran, and took every running back carry after Achane left.
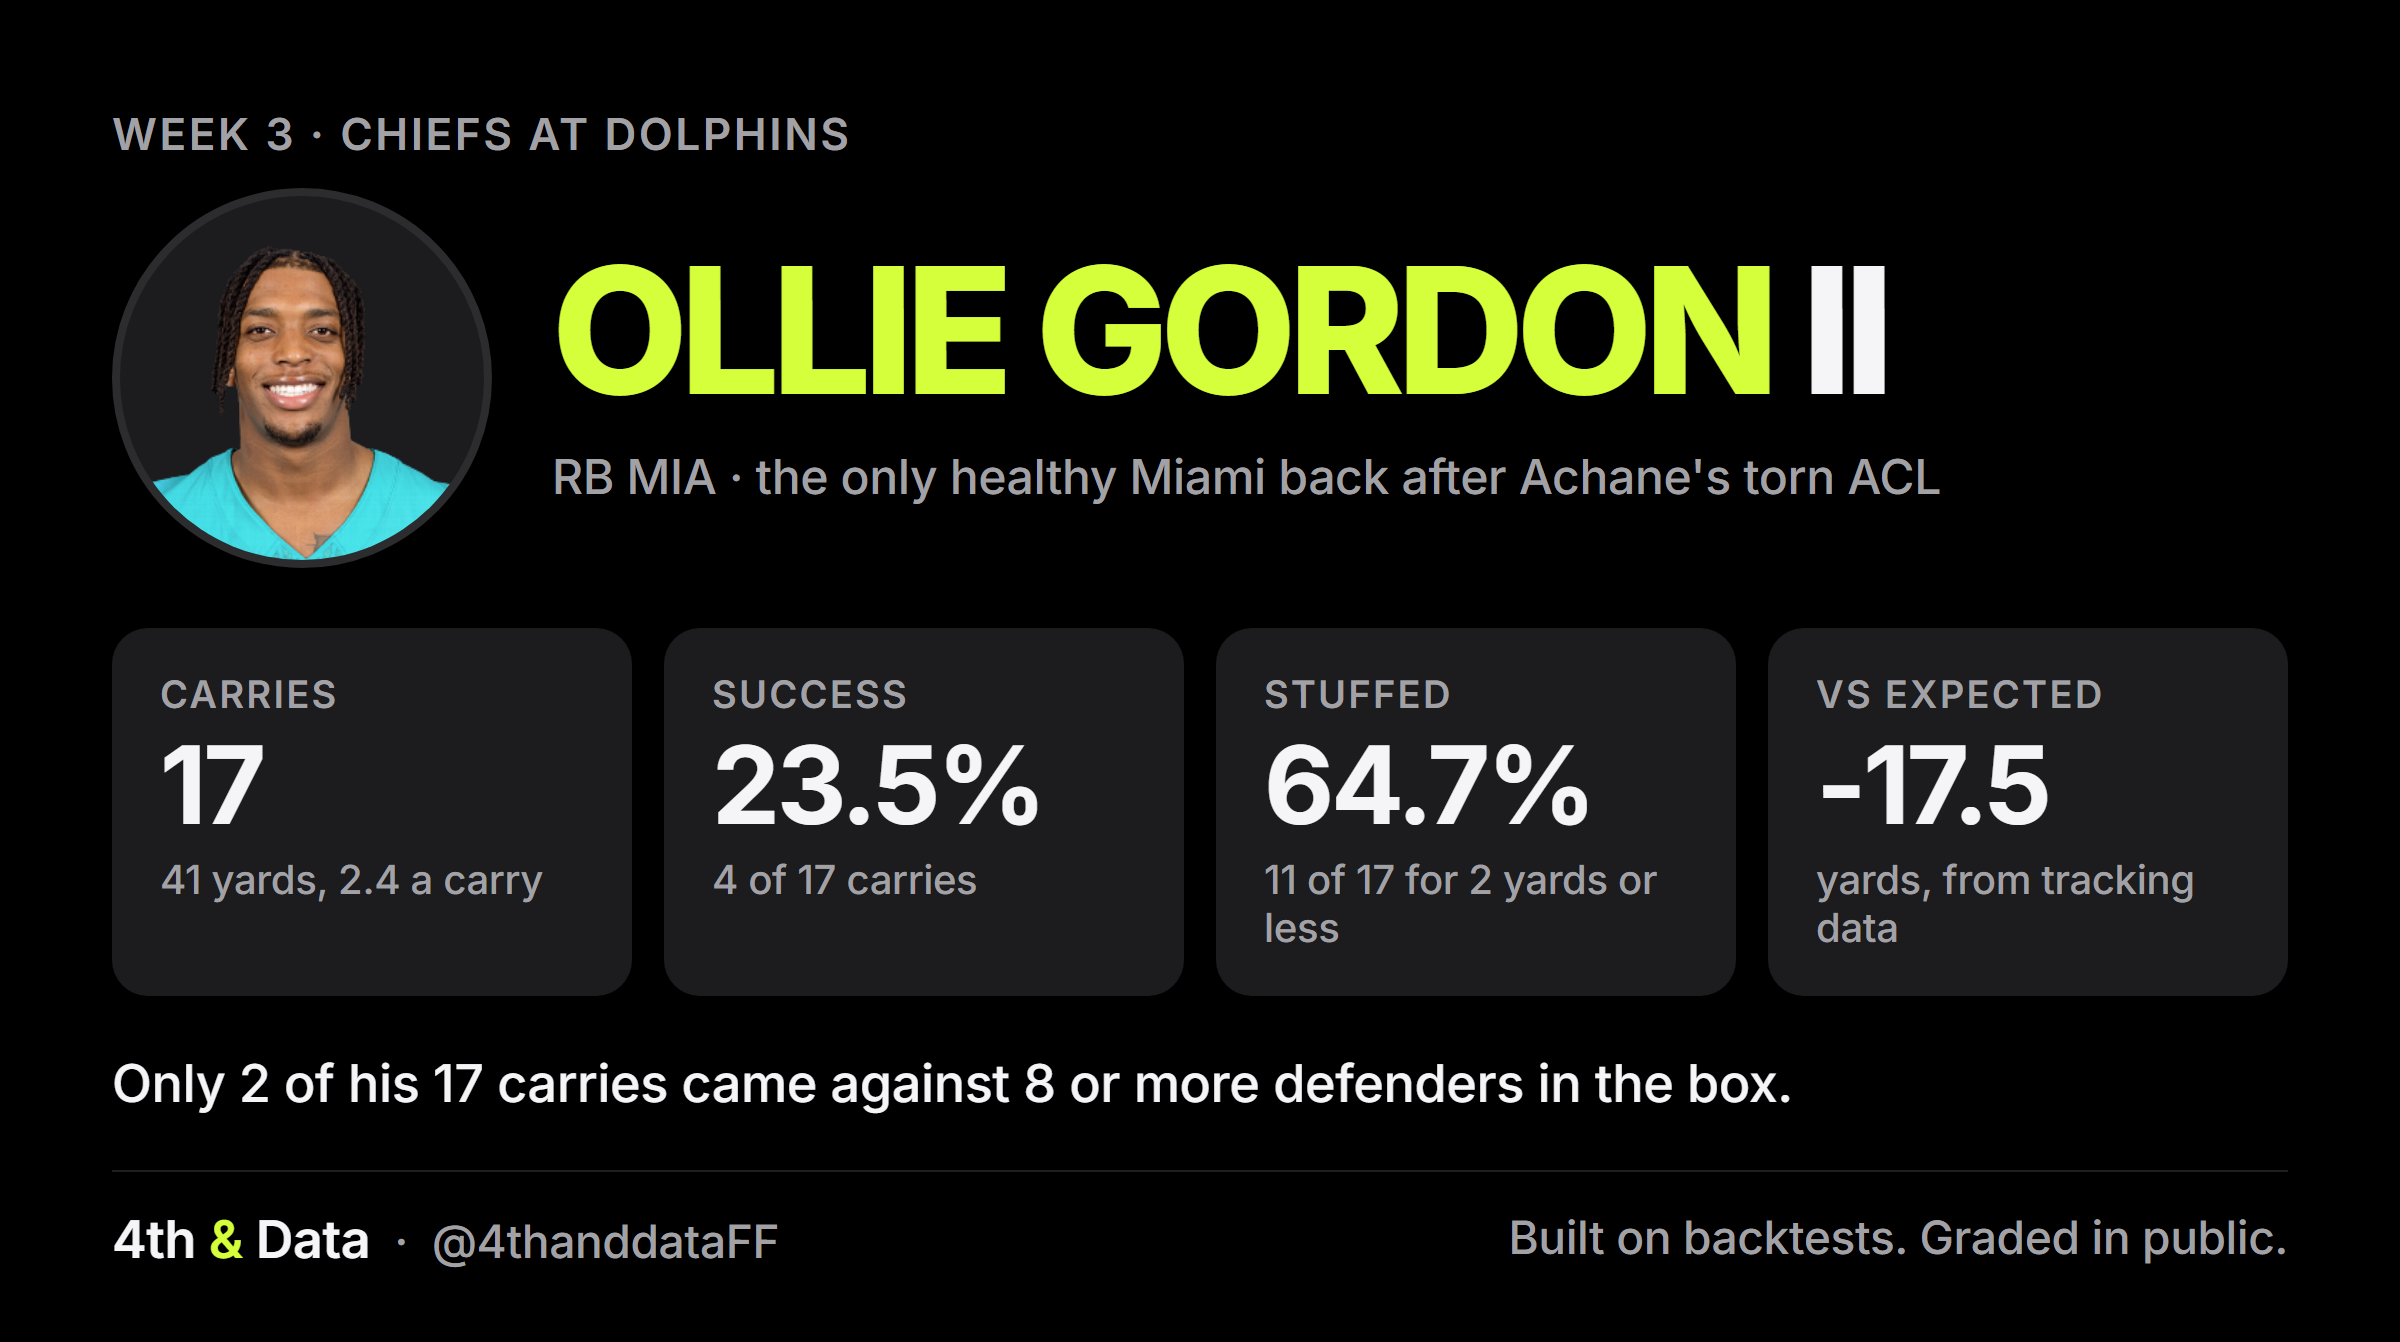
The volume was real. The running was not. He gained 41 yards on 17 carries, 2.4 a carry. Only 4 of the 17 were successful, and 11 went for 2 yards or less. His longest run went 11 yards, and without it he had 30 yards on 16 carries. On average, each of his carries lowered Miami's expected points on the drive by 0.29.
Tracking data, which follows every player on every snap, has him 17.5 yards short of what an average back would have gained on the same carries. And the defense was not loading up against him. Only 2 of his 17 carries came against 8 or more defenders near the line.
His best moment came on the opening drive, an 11-yard run on third down with 9 to go and a 3-yard touchdown on the next play. He also caught all 3 passes thrown to him, for 14 yards. The touchdown was 6 of his 14.5 points. Without it he scored 8.5.
The case against Wright
Wright has his own problem. He was worse as a rookie. In 2024 he gained 3.7 yards a carry on 68 carries, and his success rate was 39.7%, 62nd of 70 backs.
| Jaylen Wright | Yards a carry | Success | Stuffed | EPA a carry | Carries | Yards |
|---|---|---|---|---|---|---|
| 2024, rookie ranks of 70 | 3.66 55th | 39.7% 62nd | 42.6% 32nd | -0.299 67th | 68 | 249 |
| 2025 ranks of 65 | 4.11 39th | 52.9% 24th | 37.1% 13th | -0.081 45th | 70 | 288 |
| Average back, 2024 | 4.37 | 49.0% | 41.9% | -0.056 | ||
| Average back, 2025 | 4.35 | 49.5% | 41.5% | -0.051 |
His 2025 was better on almost the same number of carries. But one good year is the whole case for him.
Tracking data has a row for Wright in only two 2025 games, 37 carries in all, and he ran 25.7 yards below expected in them. Gordon's one tracked 2025 game, 10 carries, came out 3.9 yards above. Samples that small settle nothing, but they are a reason not to oversell Wright.
This season Wright has 3 carries, too few to judge, and he has to get healthy first.
When both were healthy
Usage points the same way. In the 10 games both backs played in 2025, Gordon was on the field for 133 snaps and Wright for 127, but Wright carried the ball 70 times to Gordon's 45. That split came under last year's coaching staff. Miami has a new head coach in 2026, and his depth chart still lists Wright first.
| The 10 games both played, 2025 | Wright | Gordon |
|---|---|---|
| Snaps | 127 | 133 |
| Carries | 70 | 45 |
| Targets passes thrown his way | 9 | 4 |
| Rushing yards | 288 | 134 |
| Yards a carry | 4.11 | 2.98 |
| PPR points | 48.2 | 36.8 |
| PPR points a game | 4.8 | 3.7 |
| Games with more snaps 1 tie | 4 | 5 |
All 10 games
| 2025 game | Result | Achane snap share | Wright snaps | Wright carries | Wright points | Gordon snaps | Gordon carries | Gordon points |
|---|---|---|---|---|---|---|---|---|
| Week 7 at Cleveland | Lost 31-6 | 55% | 9 | 0 | 0.0 | 18 | 5 | 2.3 |
| Week 8 at Atlanta | Won 34-10 | 67% | 11 | 9 | 3.8 | 21 | 10 | 13.6 |
| Week 10 vs Buffalo | Won 30-13 | 89% | 10 | 5 | 1.7 | 3 | 1 | -0.3 |
| Week 11 vs Washington | Won 16-13 | 80% | 1 | 1 | 0.4 | 22 | 9 | 10.5 |
| Week 13 vs New Orleans | Won 21-17 | 73% | 6 | 3 | 1.6 | 16 | 3 | 1.0 |
| Week 14 at the Jets | Won 34-10 | 34% | 34 | 24 | 16.7 | 16 | 5 | 7.7 |
| Week 15 at Pittsburgh | Lost 28-15 | 80% | 4 | 1 | 2.1 | 6 | 2 | 0.0 |
| Week 16 vs Cincinnati | Lost 45-21 | 71% | 18 | 9 | 12.3 | 3 | 1 | -0.1 |
| Week 17 vs Tampa Bay | Won 20-17 | 75% | 8 | 5 | 5.6 | 8 | 0 | 0.0 |
| Week 18 at New England | Lost 38-10 | Sat | 26 | 13 | 4.0 | 20 | 9 | 2.1 |
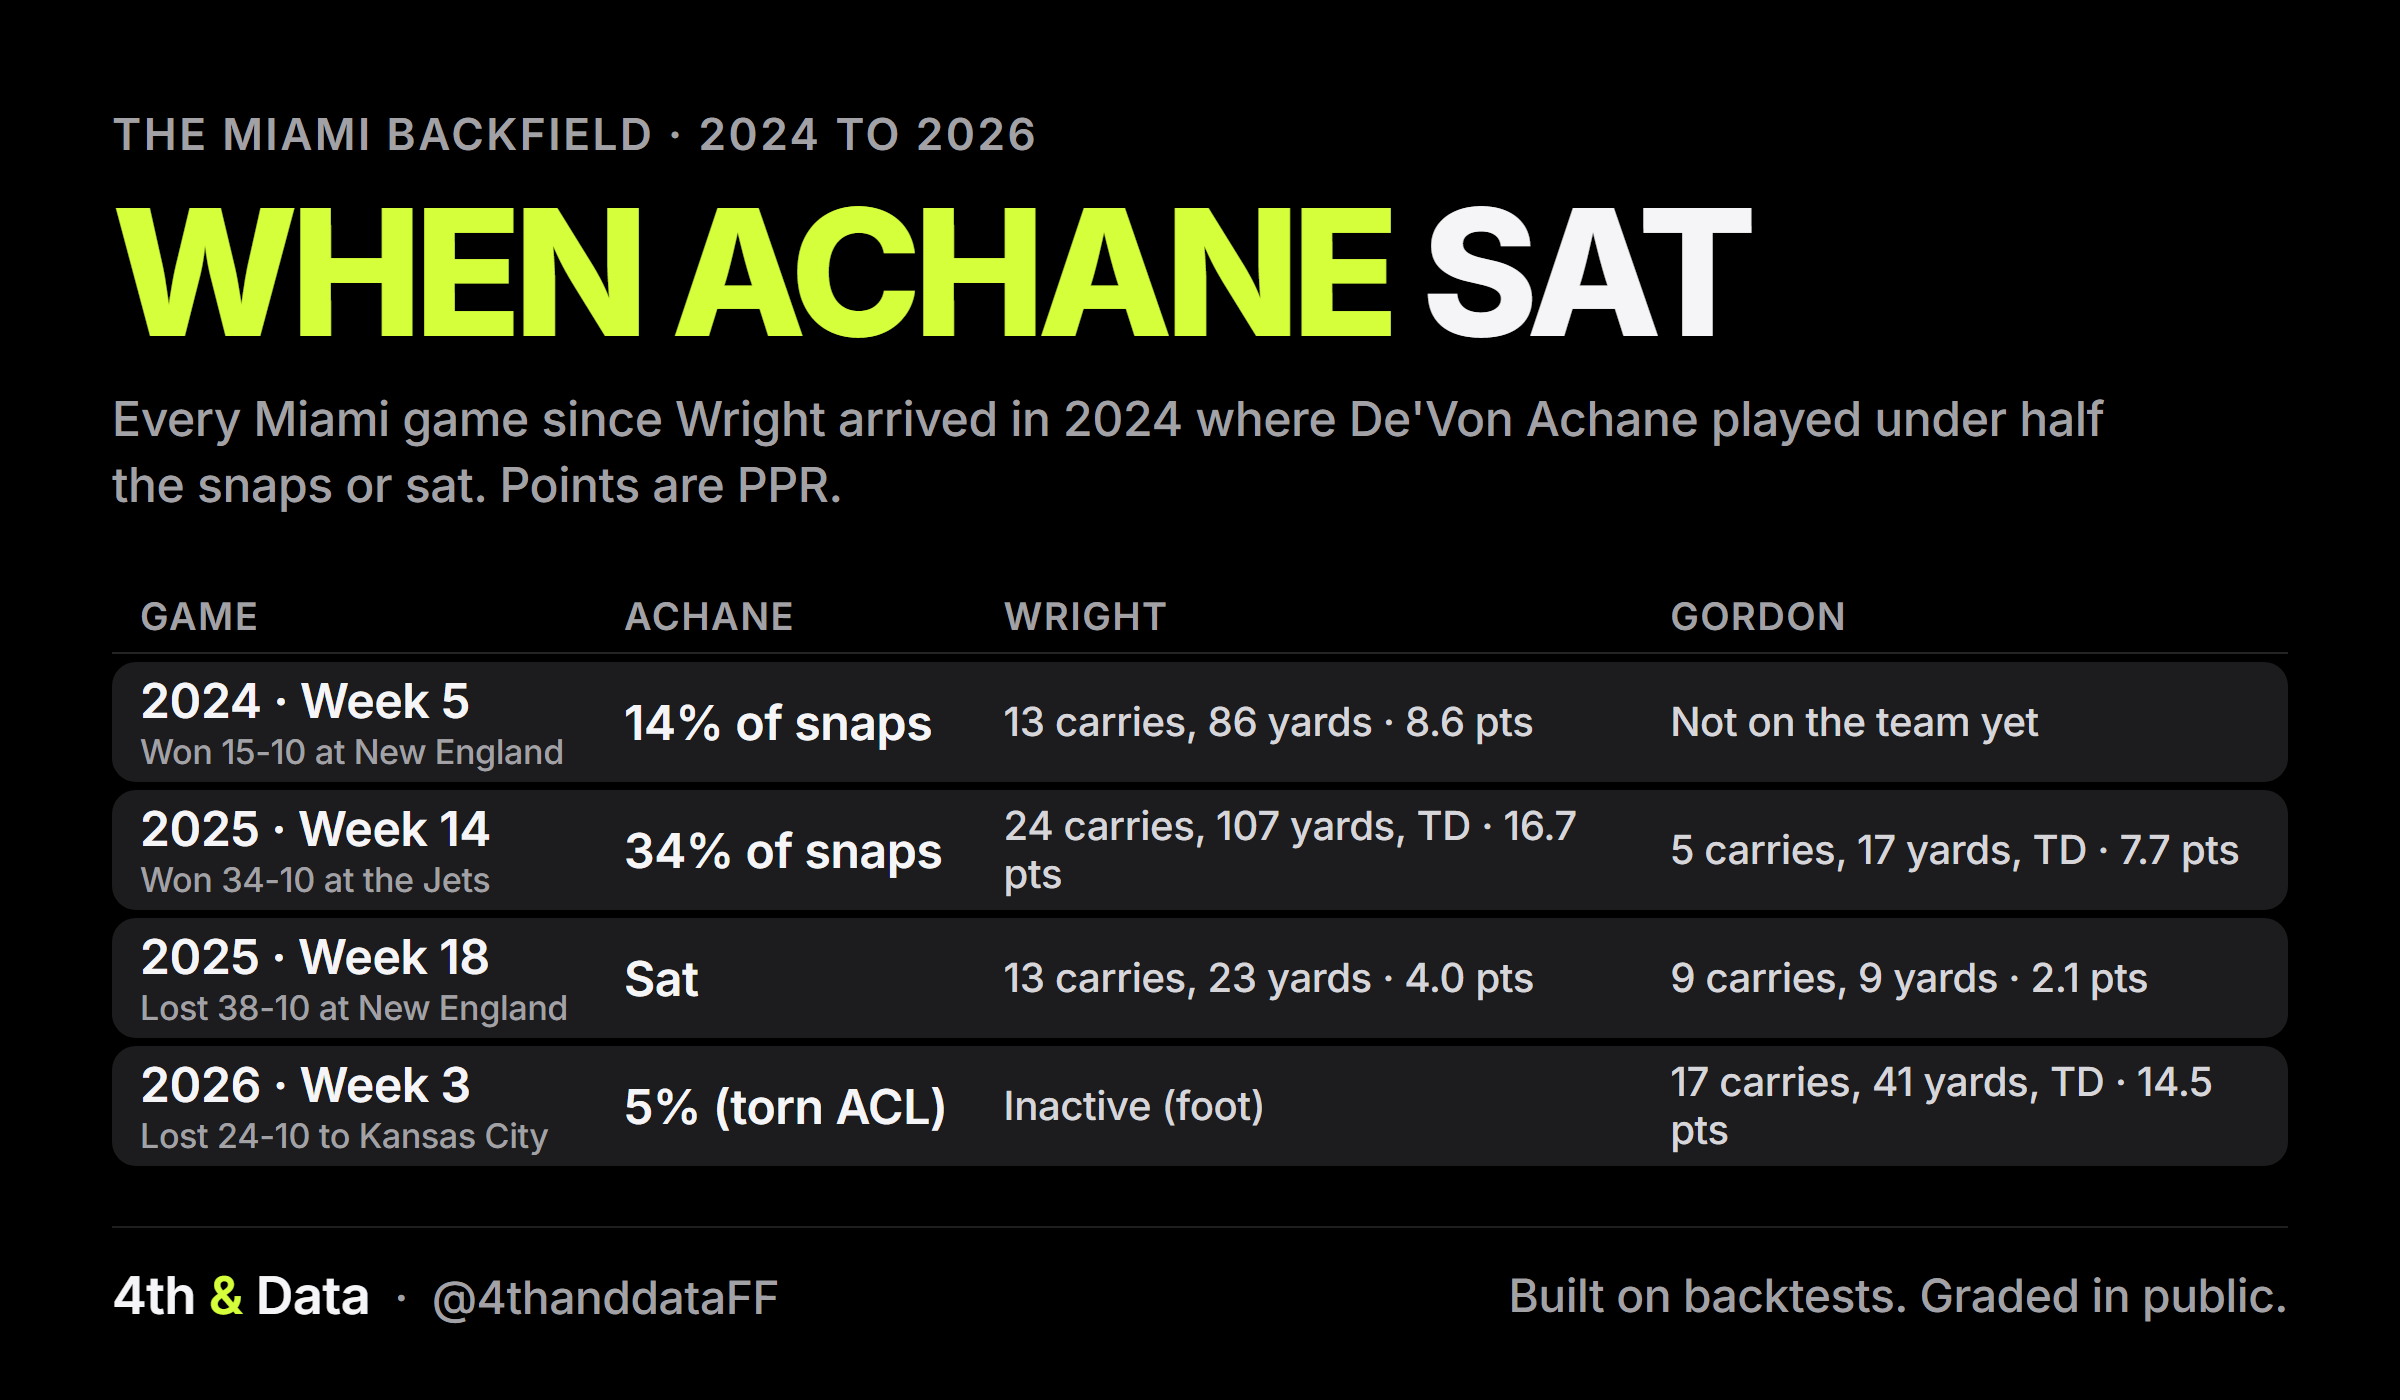
The card below covers every game since Wright arrived in 2024 where Achane played under half the snaps or sat. Miami won two of the four, 2024 Week 5 and 2025 Week 14, and Wright had 13 and 24 carries in them. In the two games where both Wright and Gordon were available, 2025 Weeks 14 and 18, Wright out-carried Gordon 24 to 5 and 13 to 9. In the two losses, neither Wright nor Gordon averaged more than 2.4 yards a carry.
The ceiling is the offense
Whoever gets the carries, the offense sets the ceiling. Miami has scored 12.0 points a game, tied for the fewest in the league, and lost its three games by 14, 22 and 14.
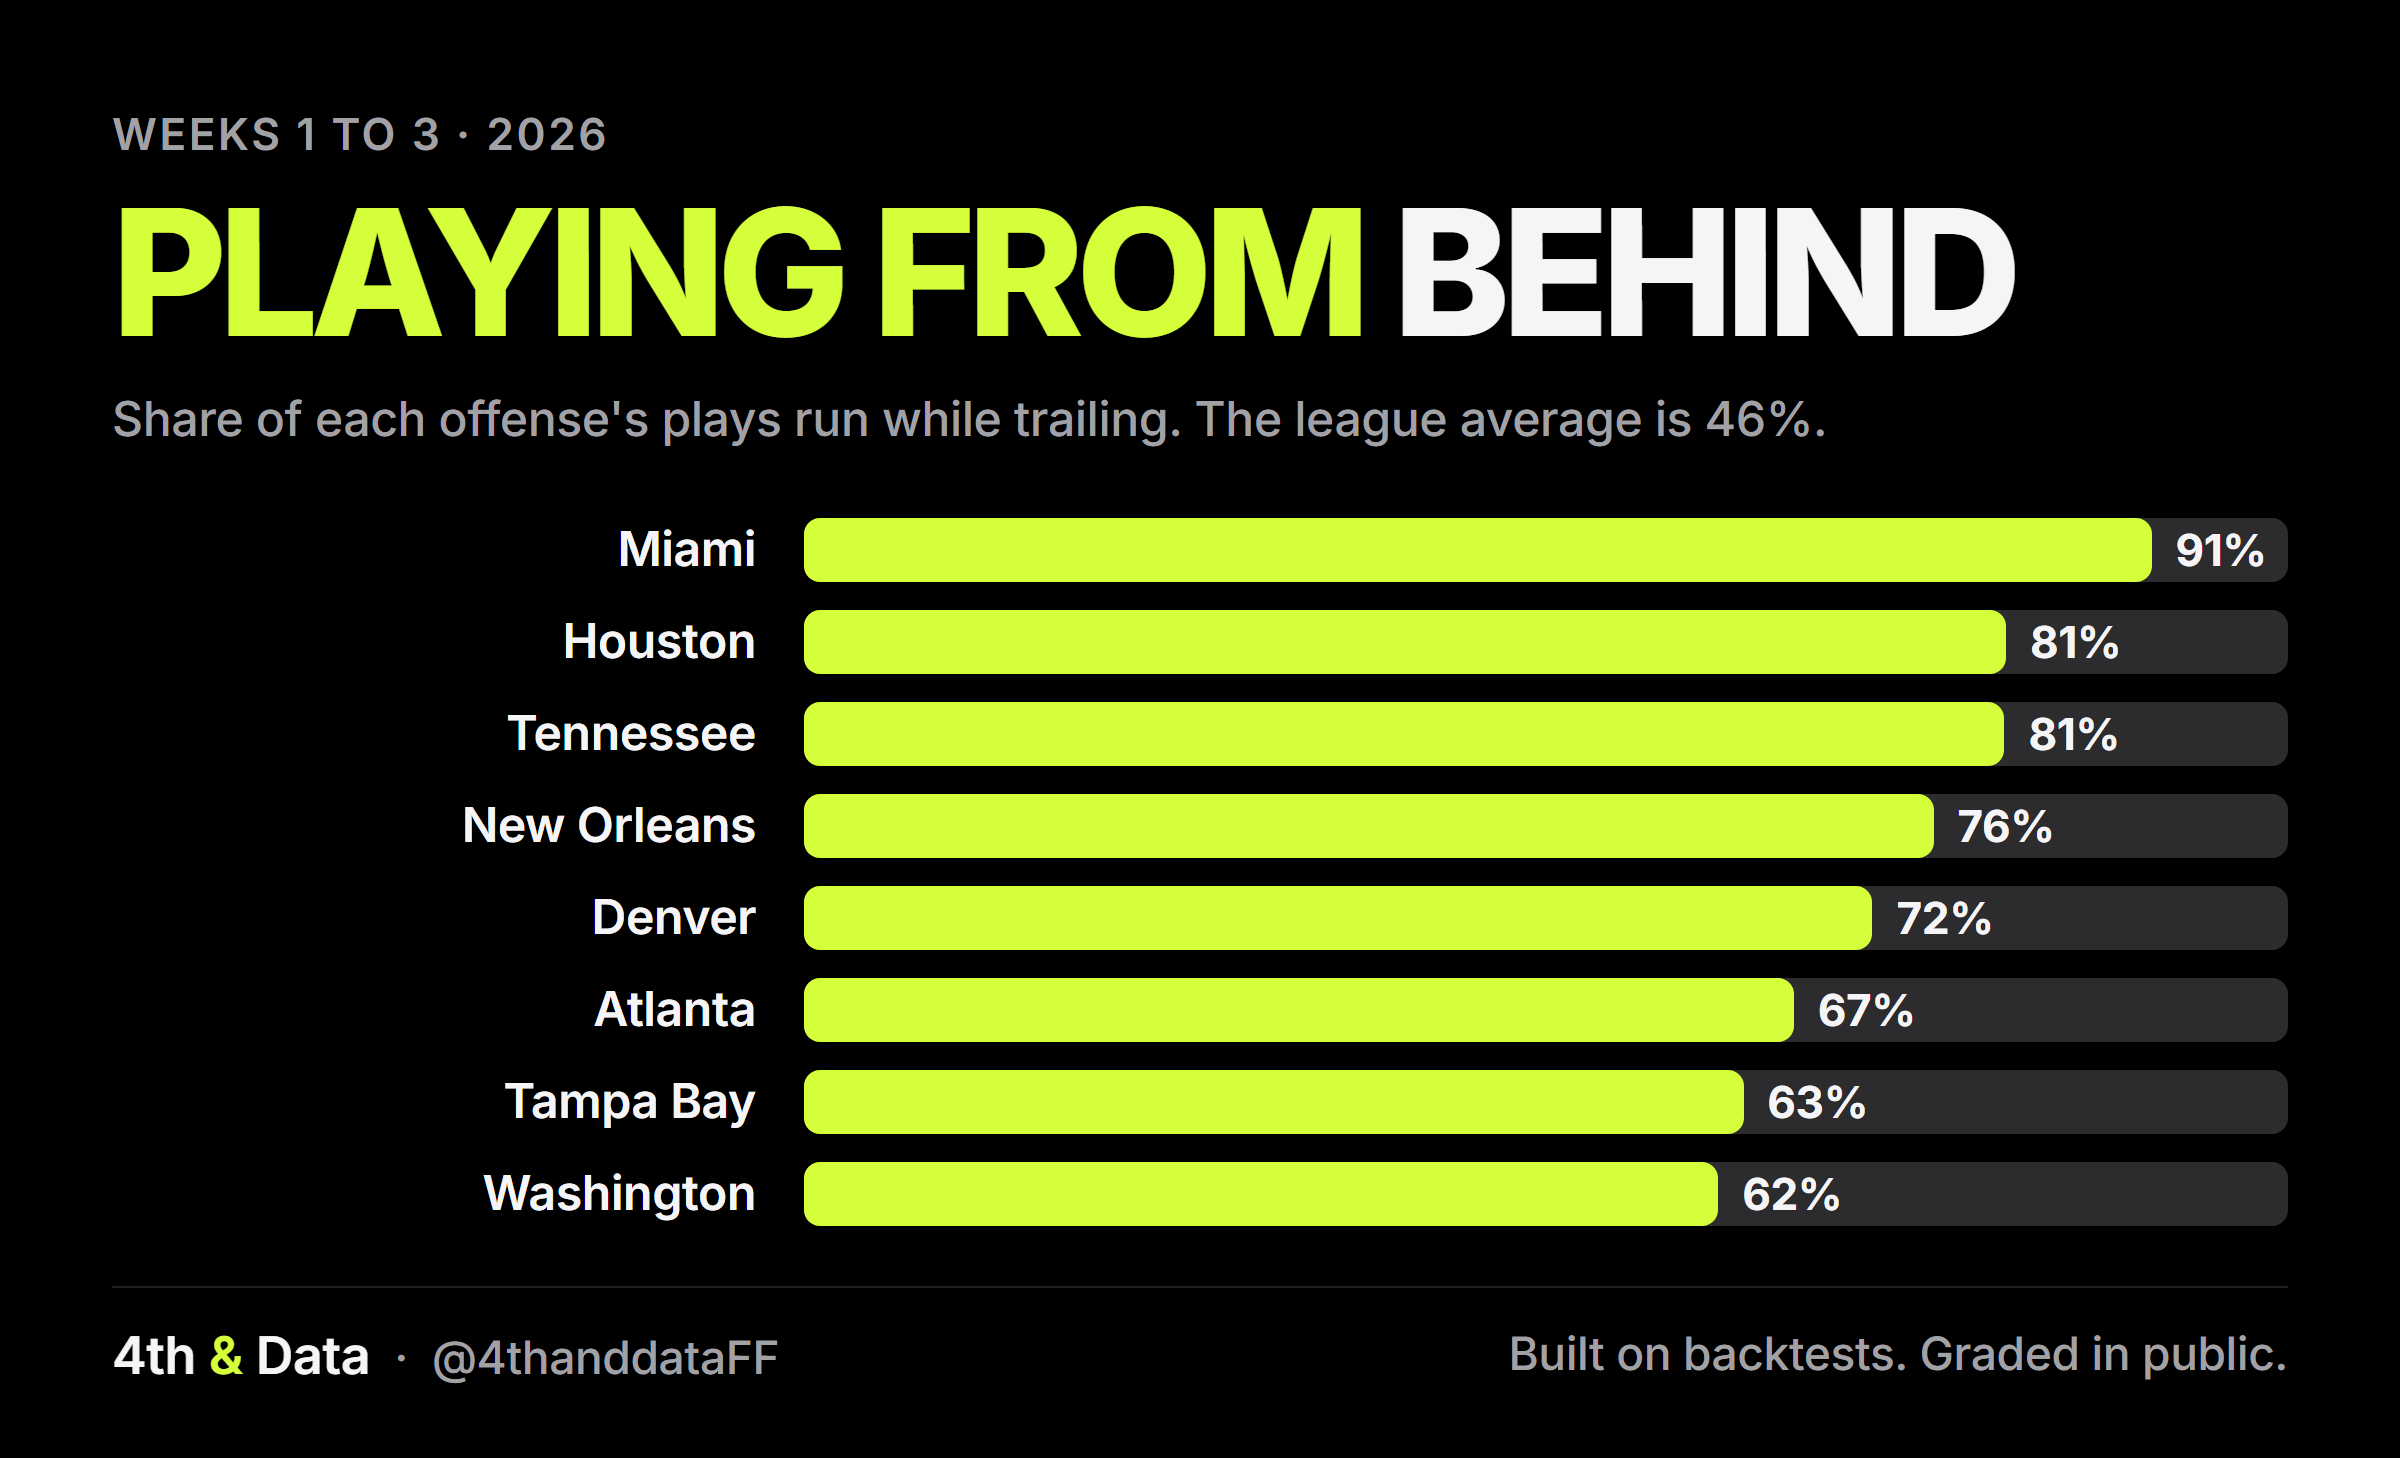
Miami has also run 90.8% of its plays while trailing, the most in the league. The average team is at 45.7%. In Week 3, Miami trailed on every play. That matters for the backs, because teams that are behind throw more. This season teams have passed on 62% of their plays while trailing and 51% while leading.
Miami's running backs have combined for 14.5 PPR points a game this season, 29th of 32 backfields. The average backfield, a team's running backs added together, scores 20.6, and the 24th-best back in fantasy is averaging 10.3 on his own. Even Achane, whose 5.67 yards a carry was 2nd of 65 in 2025, scored 10.6 and 12.3 points in his two full games this season, 24th and 17th among backs those weeks.
The call
Gordon is the most added player this week. Wright is listed ahead of him, ran better on the same carries, and will cost less.
Whoever wins the job, think J.K. Dobbins (4.5 points a game) or Jacory Croskey-Merritt (7.9), on a worse offense.
Take the cheaper one, Wright, and only if you are desperate at running back. If Wright cannot practice this week, Gordon keeps the job by default.
How we measured
- The rushing sample is every regular-season running back carry, without quarterback scrambles, kneel-downs or two-point tries. It covers 2024, 2025 and Weeks 1 to 3 of 2026, from the play by play.
- Success is a carry that gains 40% of the yards needed on first down, 60% on second, or all of them on third and fourth.
- Stuffed is a carry that gains 2 yards or less.
- EPA per carry is the points each carry added to the drive, on average.
- Yards over expected is yards gained above what an average back gets on the same carries, from tracking data. Tracking data also counts the defenders in the box, the ones lined up near the line when the ball is snapped.
- Yards after contact is yards gained after the first defender touches the runner, from charting data.
- Ranks are among backs with 50 or more carries that season.
- A backfield is every player a team lists at running back. Its points a game are their combined PPR points divided by the team's games, Weeks 1 to 3 of 2026.
- Snaps come from each game's snap counts, and "both played" means both backs show up in them. Points are PPR. The depth chart is Miami's on September 29, 2026.
Want the next one? Get the board every Tuesday, free.